Most health product design treats biomarker data as the answer.
I've learned it isn't. It's the input but not the answer. The answer is how it makes people feel, how it changes their behaviour, it's what someone does on Tuesday morning when they see it.
Diagnostic tools love to render data as truth. A dashboard with a red bar showing how unhealthy you are. A panel of percentile rankings. A PDF of biomarkers and acronyms. Power users will revel in it, absolutely. But for the masses, things get more nuanced. People get anxious, overwhelmed, they don't know what to do with it, and churn within two weeks. We've been so used to being insulated from the data points, we need helpful conclusions.
Going too deep on data was a mistake Arivale made back in 2015. They had the data. They didn't have the translation layer. They struggled to provide long term value that users could understand and in the pre-AI world, relying on healthcare professionals and expensive tests meant CAC vs LTV skyrocketed. Having AI do the diagnostics is great, but how you surface those insights determines how well users understand what you're providing, which determines perceived value (and churn). As I see it, provided this value can be understood by your users, you're poised for success since the community and pre-existing userbase can insulate you from those market pressures, being a consumer-health product with an e-commerce loop is an unfair advantage and it's why I'm keen to come onboard to Healf.
The framework I'd bring to Healf Bloods.
Wellbeing Intelligence should be three things at once:
Empathetic
Insights presented in a tone that takes the user's age, fitness, literacy and attitude into account. Inform and motivate — don't scare, overwhelm, or bore.
Understandable
Progressive disclosure. Conclusion first. Then the explanation. Only then the raw data, for the power users and the next clinician.
Actionable
Help the user take a step in the right direction — even a small one. Control breeds engagement. Engagement breeds retention. Retention breeds outcomes.
How to surface: Conclusion → Explanation → Data.
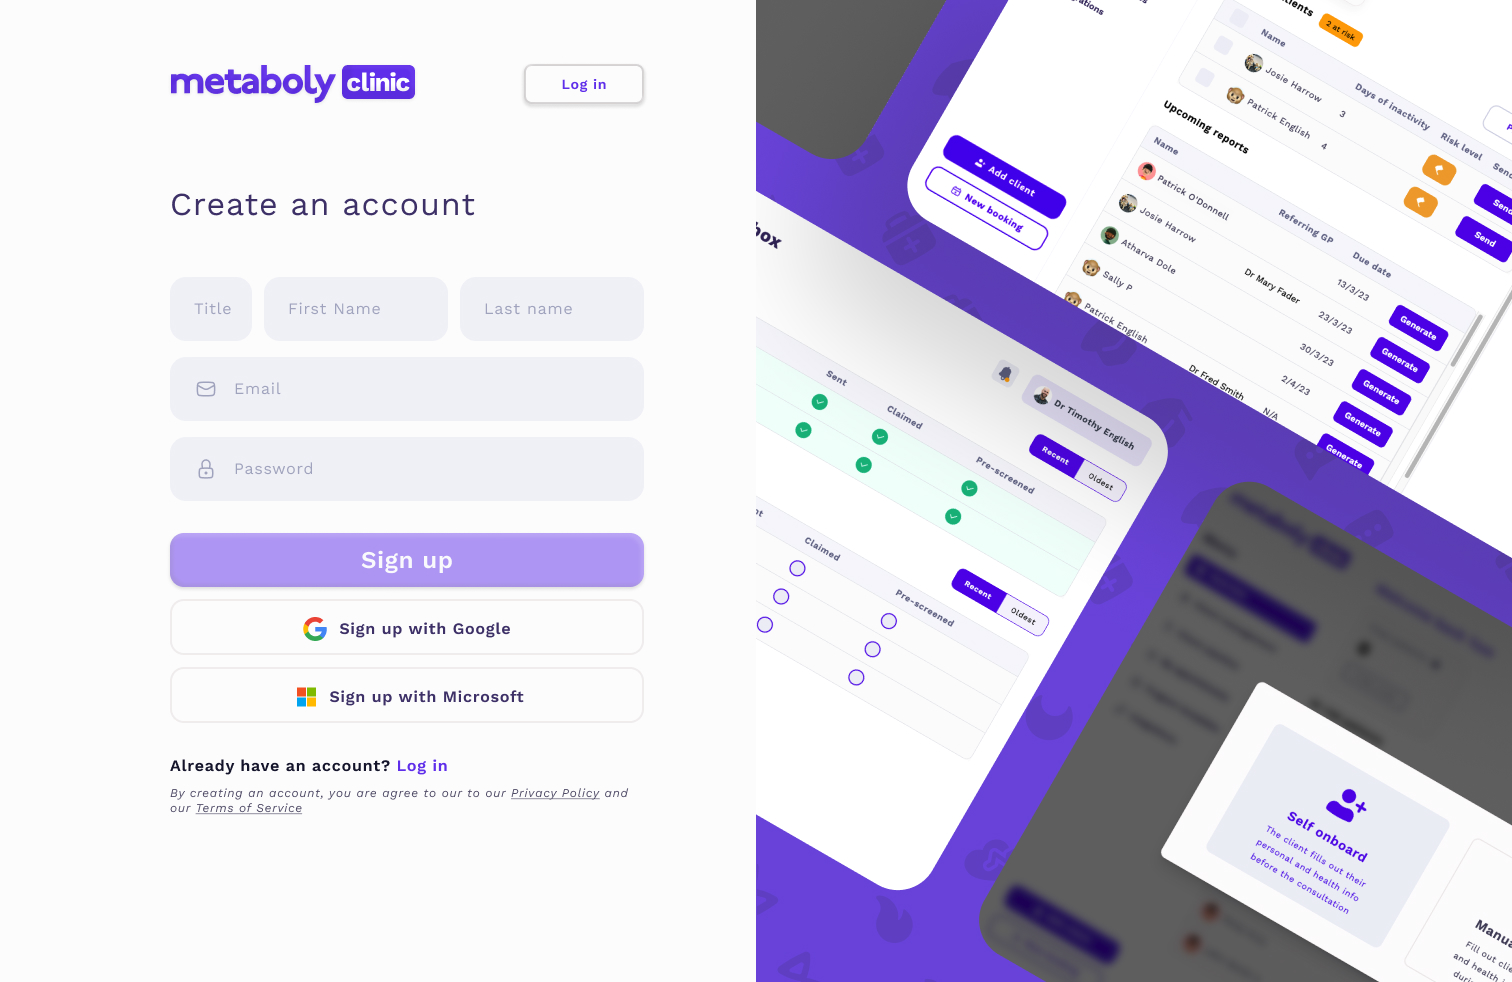
This was my key finding after years doing Metaboly and it came from countless hours talking to clinicians and patients, and the experience I had developed designing fintech dashboards at Wisr.
What this looks like in practice
Your biomarkers are 40% above the median.
Based on your blood data, skipping coffee after 11am this week will likely improve your deep sleep — and how focused you feel by Friday.
Trust at scale
Healf is moving from a curated e-commerce store to a predictive companion. The hard part isn't the diagnostics. The hard part is making the user feel like the product is on their side.
Trust at scale requires three things: a tone that's empathetic without being condescending, a structure that progressively discloses instead of dumping data, and recommendations that feel personalised and earned by the data, not generated.